
|
TopNax |
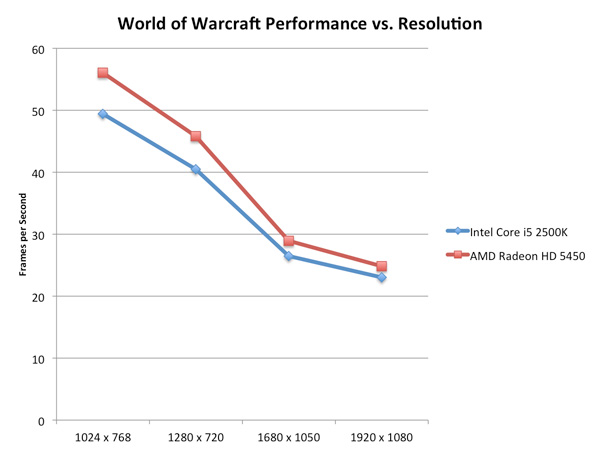
Resolution Scaling with Intel HD Graphics 3000All of our tests on the previous page were done at 1024x768, but how much of a hit do you really get when you push higher resolutions? Does the gap widen between a discrete GPU and Intel's HD Graphics as you increase resolution? On the contrary: low-end GPUs run into memory bandwidth limitations just as quickly (if not quicker) than Intel's integrated graphics. Spend about $70 and you'll see a wider gap, but if you pit Intel's HD Graphics 3000 against a Radeon HD 5450 the two actually get closer in performance the higher the resolution is—at least in memory bandwidth bound scenarios:
Call of Duty: Modern Warfare 2 stresses compute a bit more at higher resolutions and thus the performance gap widens rather than closes:
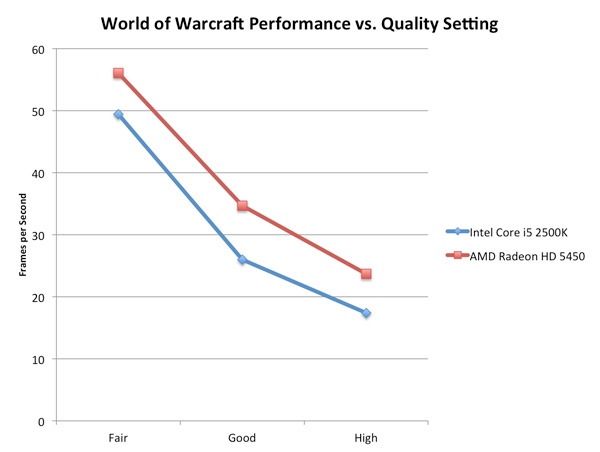
For the most part, at low quality settings, Intel's HD Graphics 3000 scales with resolution similarly to a low-end discrete GPU. Graphics Quality ScalingThe biggest issue with integrated and any sort of low-end graphics is that you have to run games at absurdly low quality settings to avoid dropping below smooth frame rates. The impact of going to higher quality settings is much greater on Intel's HD Graphics 3000 than on a discrete card as you can see by the chart below.
The performance gap between the two is actually its widest at WoW's "Good" quality settings. Moving beyond that however shrinks the gap a bit as the Radeon HD 5450 runs into memory bandwidth/compute bottlenecks of its own. |
Overclocking Intel's HD GraphicsThe base clock of both Intel's HD Graphics 2000 and 3000 on desktop SKUs is 850MHz. Thankfully, Intel's 32nm process allows for much headroom in both the CPU and GPU for overclocking. There are no clock locks or K-series parts to worry about when it comes to GPU overclocking; everything is unlocked. I started by trying to see how far I could push the Core i3-2100's HD Graphics 2000. While I could get into Windows and run games at up to 1.6GHz, I needed to back down to 1.4GHz to maintain stability across all of our tests. That's a 64.7% overclock:
In some cases (Civilization V, WoW, Dawn of War II), the overclocked HD Graphics 2000 was enough to bring the 6 EU part close to the performance of the 3000 model. For the most part however the overclock just helped the Core i3-2100 perform halfway between it and the Core i5-2500K. I tried the same experiment with the Core i5-2500K. While there's no chance it could catch up to a Radeon HD 5570, I managed to overclock my 2500K to 1.55GHz (the GPU clock can be adjusted in 50MHz increments):
The 82.4% increase in clock speed resulted in anywhere from a 0.6% to 33.7% increase in performance. While that's not terrible, it's also not that great. It looks like we're fairly memory bandwidth constrained here. |
|
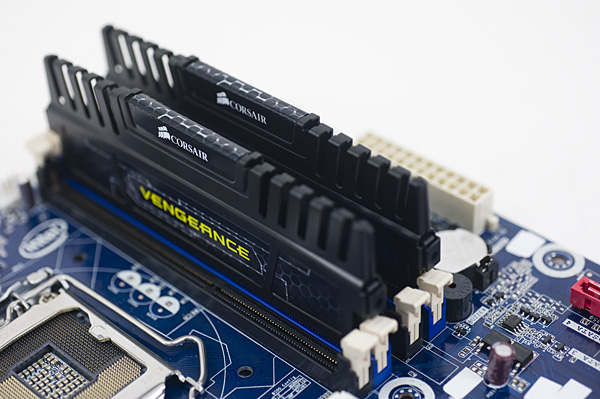
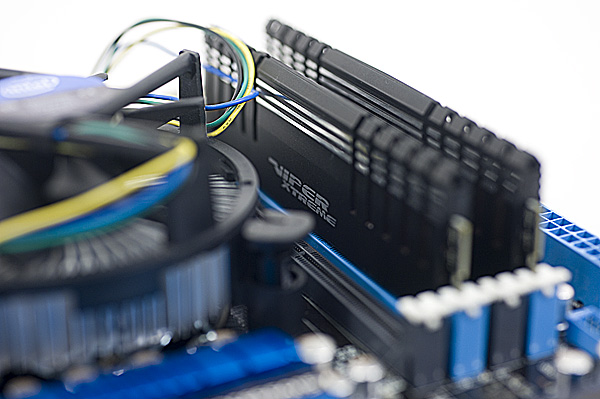
Special thanks to Corsair for sending an 8GB Vengeance kit for this review: As well as Patriot for sending an 8GB Viper Xtreme kit:
All of our brand new tests (Civilization V, Visual Studio) use 8GB memory configurations enabled by both Corsair and Patriot. |
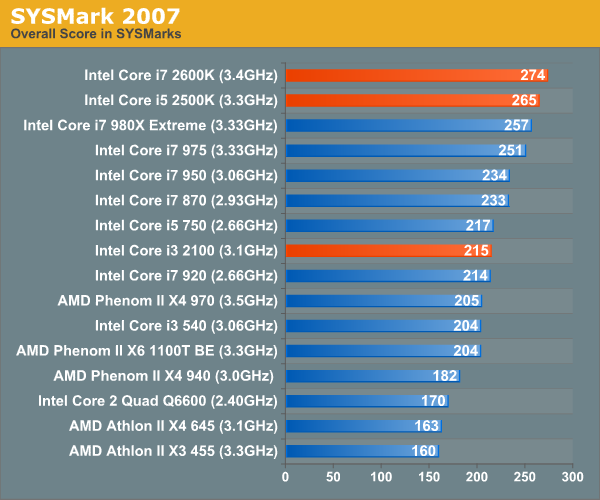
General Performance: SYSMark 2007Our journey starts with SYSMark 2007, the only all-encompassing performance suite in our review today. The idea here is simple: one benchmark to indicate the overall performance of your machine. SYSMark 2007 ends up being more of a dual-core benchmark as the applications/workload show minimal use of more than two threads.
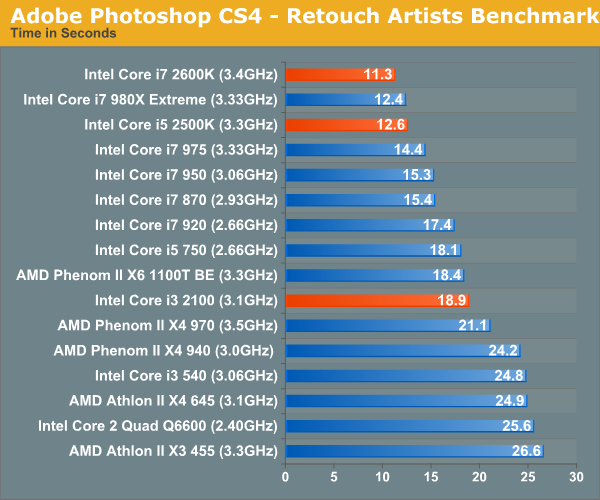
The 2600K is our new champion, the $317 chip is faster than Intel's Core i7 980X here as SYSMark 2007 doesn't really do much with the latter's extra 2 cores. Even the 2500K is a hair faster than the 980X. Compared to the Core i5 750, the upgrade is a no brainer - Sandy Bridge is around 20% faster at the same price point as Lynnfield. Compared to Clarkdale, the Core i3 2100 only manages a 5% advantage howeer. Adobe Photoshop CS4 PerformanceTo measure performance under Photoshop CS4 we turn to the Retouch Artists’ Speed Test. The test does basic photo editing; there are a couple of color space conversions, many layer creations, color curve adjustment, image and canvas size adjustment, unsharp mask, and finally a gaussian blur performed on the entire image. The whole process is timed and thanks to the use of Intel's X25-M SSD as our test bed hard drive, performance is far more predictable than back when we used to test on mechanical disks. Time is reported in seconds and the lower numbers mean better performance. The test is multithreaded and can hit all four cores in a quad-core machine.
Once again, we have a new king - the 2600K is 9.7% faster than the 980X in our Photoshop CS4 test and the 2500K is just about equal to it. The Core i3 2100 does much better compared to the i3 540, outpacing it by around 30% and nearly equaling the performance of AMD's Phenom II X6 1100T. |
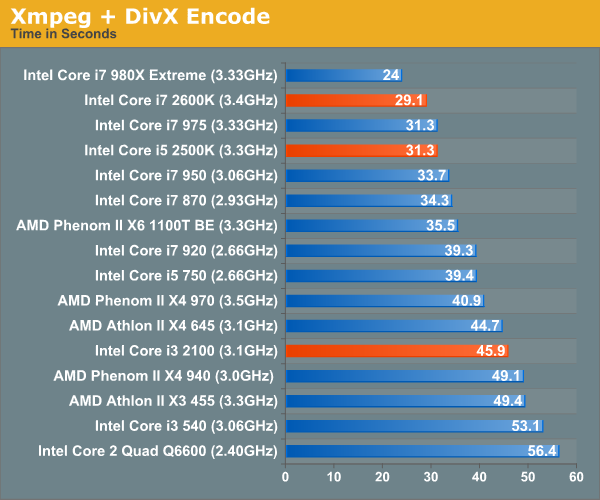
Video Encoding PerformanceOur DivX test is the same DivX / XMpeg 5.03 test we've run for the past few years now, the 1080p source file is encoded using the unconstrained DivX profile, quality/performance is set balanced at 5 and enhanced multithreading is enabled.
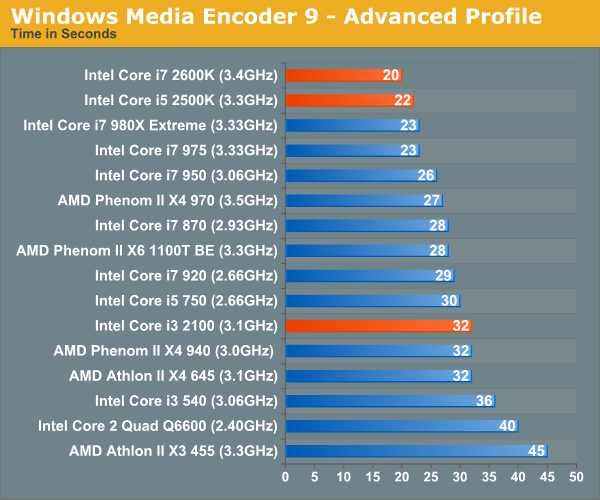
Despite the greatness that is Quick Sync, there are no editing/high quality transcode tools that support Intel's hardware transcode engine. Luckily, Sandy Bridge is still very fast when it comes to software encoding. Our WME test only shows minimal gains thanks to the architectural improvements however.
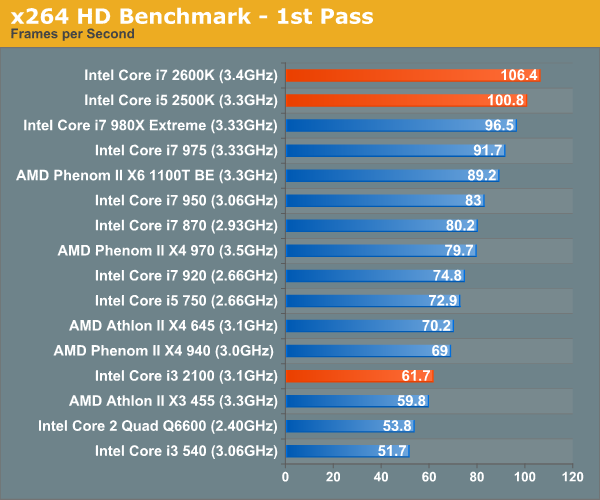
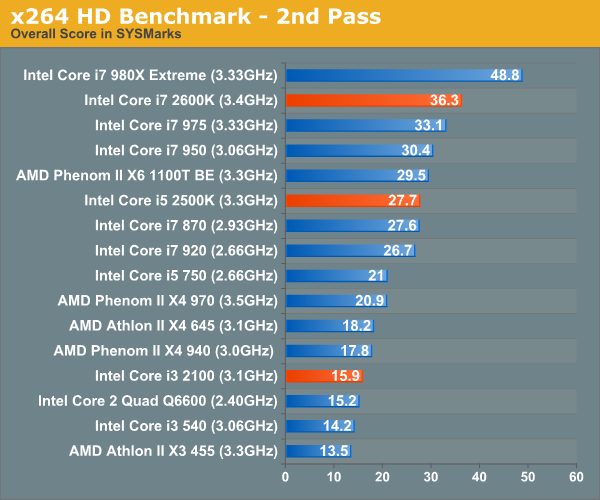
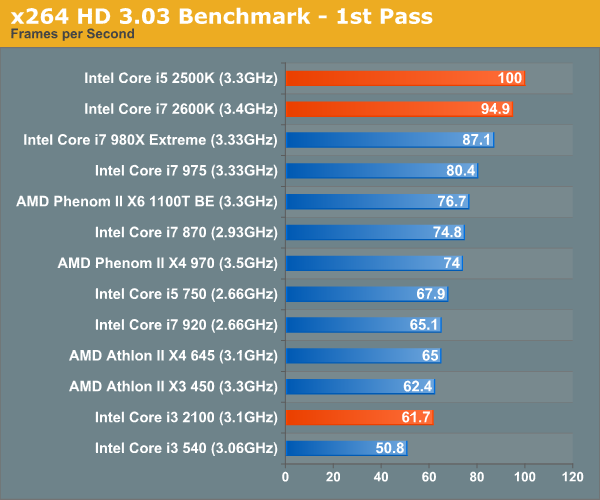
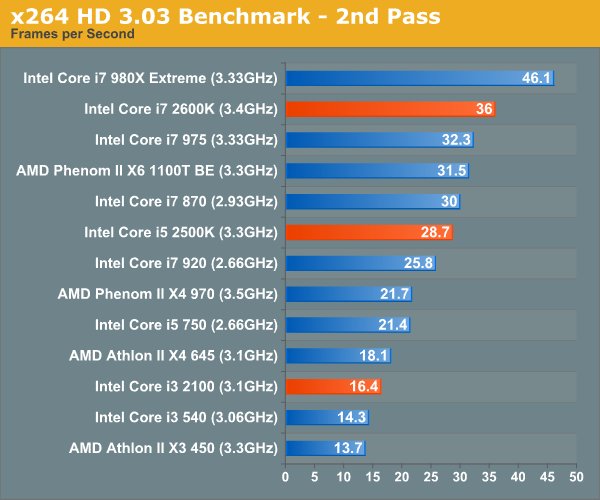
Graysky's x264 HD test uses x264 to encode a 4Mbps 720p MPEG-2 source. The focus here is on quality rather than speed, thus the benchmark uses a 2-pass encode and reports the average frame rate in each pass. Other than the Core i7 980X, there's nothing quicker than Sandy Bridge. The Core i7 2600K is 10% faster than the Core i7 975, and the 2500K easily outpaces its Lynnfield rivals. The i3 2100 is quicker than its predecessor, however not by much. In these heavily threaded situations, AMD's Athlon II X4 645 is a better option than the 2100.
|
